Find out how you can digitize your production
with solutions from MPDV!
Overall Equipment Effectiveness / OEE – Smart Factory Glossary

OEE Definition
Overall Equipment Effectiveness, or OEE for short, is a process key figure companies can use to assess the productivity of their machines and production units. The OEE is made up of three lower-level key figures: availability rate, performance level and quality rate. Based on the OEE, suitable measures can be derived to improve the efficiency and process reliability of machinery and assembly stations. The OEE index works well as a target for operators, setters, supervisors, and maintenance staff.
Overall Equipment Effectiveness is best determined on the basis of production and machine data that is collected in a Manufacturing Execution System (MES). Calculation of the OEE only makes sense if reliable data is collected. Incomplete and inaccurate data can distort the picture of the effectiveness of production units.
OEE calculation
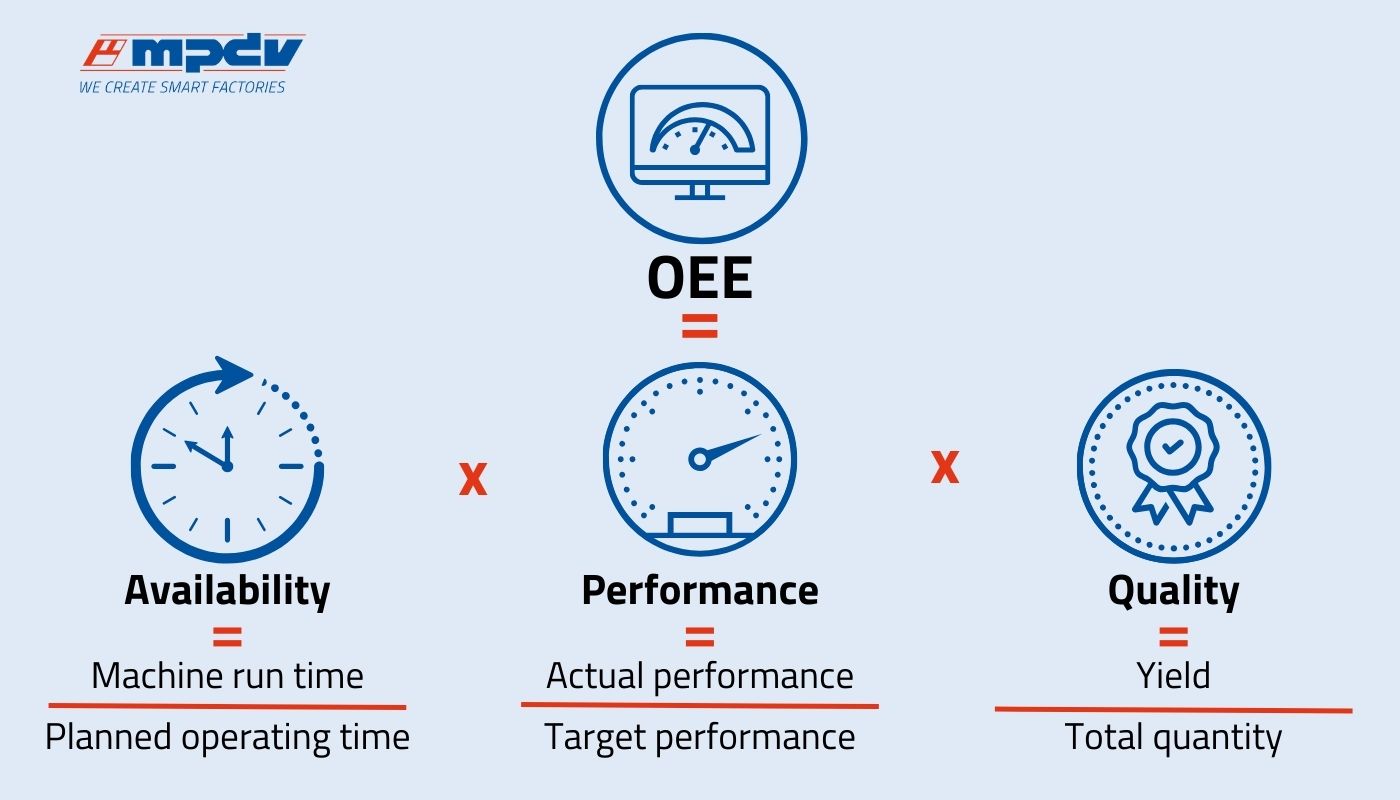
The Overall Equipment Effectiveness is calculated with the three mentioned factors: availability, performance, and quality. Each factor represents a different aspect of equipment effectiveness.
- Availability: ratio of machine run time to the time available
- Performance: ratio of the current speed to the planned speed
- Quality: ratio of yield to the total produced quantity
This guide explains the OEE calculation step by step.
Calculation of availability rate: Availability is calculated by dividing the actual operating time of a machine (machine run time) by the target production time (planned operating time).
Calculation of performance level: The performance is calculated by dividing the actual production quantity (actual performance) by the theoretically possible production quantity (target performance) at full speed during the time the machine is running.
Calculation of the quality rate: The quality is calculated by dividing the number of parts passed (yield) without defects and reworking by the total number of parts produced (total quantity).
Calculation of the Overall Equipment Effectiveness: Once all three factors are known, the OEE can be determined. To do so, all three factors are multiplied with each other. Below is the formula to calculate the OEE:
Availability rate × Performance level × quality rate = OEE
The following data can be used to calculate the availability rate, the performance level, and the quality rate:
Planned production time: 720 minutes
Actual production time: 600 minutes
Max. produced quantity: 1,200 parts
Produced quantity: 1,000 parts
Yield: 900 parts
Scrap: 100 parts
- Availability: 600 / 720 = 0.833 → 83.3%
- Performance: 1,000 / 1,200 = 0.833 → 83.3%
- Quality: 900 / 1,000 = 0,9 x 100 → 90%
You can determine the Overall Equipment Effectiveness with the formula Availability rate × Performance level × quality rate = OEE
0.833 x 0.833 x 0.90 = 0.624 → 62.5%
The OEE of the production unit is in this example 62.5%.
For the total OEE of multiple production units, the OEE index of each individual production unit is determined first, as shown in the example above. The different production unit capacities are then weighted according to the production quantity.
Production unit 1: OEE = 65% with a produced quantity of 1,300 parts
Production unit 2: OEE = 80% with a produced quantity of 1,800 parts
The weighted average is important for the total OEE. To do so, the OEE of production unit 1 is multiplied by its production quantity. The same goes for production unit 2.
Production unit 1: 0.65 x 1,300 = 845
Production unit 2: 0.80 x 1,800 = 1,440.
The values are added up in the next step.
845 + 1,440 = 2,285
The sum is then divided by the total number of produced parts.
2,285 / 3,100 = 0.737
The OEE for both production units is 73.7%.
Note on the OEE calculation
If you calculate the OEE for multiple production units in this way, you should be aware that it only applies to machines that work in parallel or independently of each other. As soon as the machines are grouped together in a line or work one after the other, you need to multiply the individual OEE indexes. This means that the more machines are interlinked, the lower the overall OEE becomes. As the significance of the result is reduced when calculating OEE for multiple production units as well as for entire production lines, the calculation is often conducted for each machine.
Meaning of the OEE index
The OEE index is normally indicated as percentage. The ideal value of the OEE is 100%. This means, that only parts are produced that pass the quality control without interruptions or malfunctions, which is impossible to achieve in the real world.
An OEE of 80% or more is considered a very good value for discrete manufacturing processes. Many manufacturing sites achieve a value of around 60%. An OEE below 40% indicates that there is a considerable need for improvement and that doubling the overall equipment effectiveness is quite realistic.
Relationship between OEE and TPM
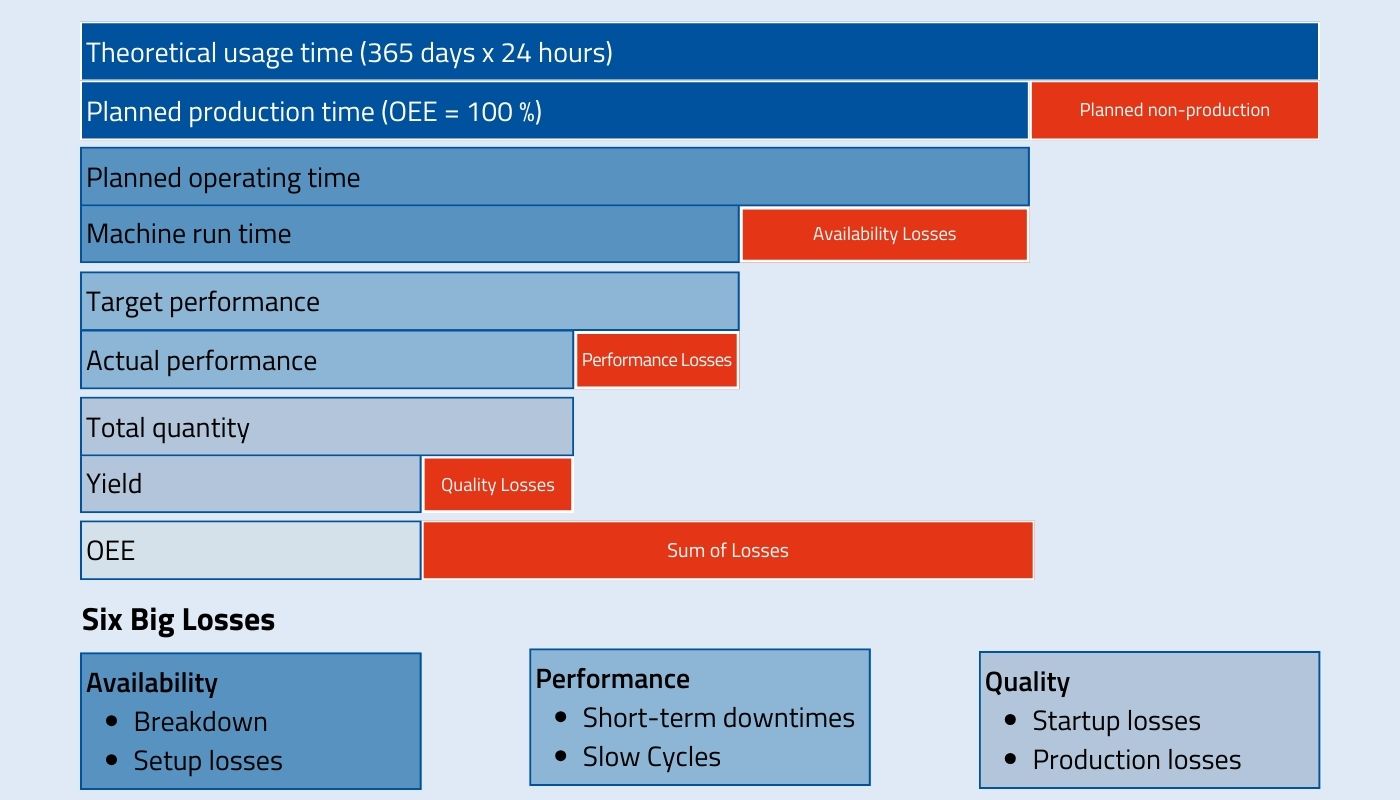
The OEE is a central part of the Total Productive Maintenance (TPM). This approach aims to maintain machines while maximizing their effectiveness. The Overall Equipment Effectiveness was designed to determine the three main sources of loss in production. Each of the three reasons for loss is assigned two types of loss to which the highest efficiency losses are to be attributed. The sources of loss with their six types of loss or Six Big Losses are:
- Loss of availability due to equipment failures and loss of time in setup, i.e., when machines and equipment run for a shorter time than planned due to malfunctions or maintenance, for example.
- Performance losses due to brief downtimes and cycle time losses, i.e., when production takes place at a lower speed than would actually be possible.
- Quality losses due to start-up problems of machines and poor quality, i.e., when products do not meet the specifications and have to be reworked or cannot be used.
By combining the three metrics of availability, performance, and quality into a single OEE figure, a true picture of Overall Equipment Effectiveness is created. The idea is that a production unit can only be considered fully effective if all three factors are optimized simultaneously The OEE supports the overarching goal of TPM in terms of Lean Manufacturing. According to the principles of Lean Manufacturing all types of waste in the production environment need to be identified and then eliminated.
Benefits of the OEE
Determining and optimizing the Overall Equipment Effectiveness contributes to the goal of zero-defect production, which is pursued in line with the Industry 4.0 philosophy. If companies are aware of the most common types of loss, they can make targeted improvements. Small changes often result in a much better OEE index and help industrial companies to remain competitive.
- Increased efficiency: Based on comprehensive data on availability, performance and quality rates, sources of loss can be precisely identified and eliminated or at least reduced. Production unit capacities can be better utilized by planning maintenance in advance, avoiding downtimes and minimizing setup times. Bottlenecks can also be prevented.
- Quality improvement: OEE considers quality of the parts produced. High quality rates mean less rework, fewer rejects, and greater customer satisfaction.
- Cost reduction: Inefficiencies and interruptions cause excessive costs in production. If the OEE index is improved, downtimes can be reduced, machine performance increased, and the reject rate lowered. In the end, all these factors are helping to reduce costs.
- Increased transparency: If all data is recorded, stored, and analyzed in a Manufacturing Execution System, you can see at once how changes affect productivity.
- Continuous improvement: OEE is a key indicator as part of Lean Manufacturing and Continuous Improvement Processes (CIP). It provides a precise metric to measure progress and guide improvement initiatives: as soon as Overall Equipment Effectiveness decreases, optimizations can be initiated to increase productivity.
OEE index and MES
A manufacturing execution system (MES) collects all data that exist in production. Ideally, the data is transferred directly from the machines or system control. The information can also be collected manually with a tablet or an industry PC. The MES calculates from the data essential production key figures like the OEE.
Find below shop floor data used to calculate OEE and other production key figures:
- Machine data: e.g., machine status, utilization, malfunctions
- Process data: e.g., temperature, pressure, runtime, maintenance
- Energy data: e.g., electricity consumption, gas, water, compressed air, etc., power consumption
- Order data: e.g., quantities, times
- Quality data: e.g., scrap, failure reasons
Work examples:
An injection molding machine achieves an OEE index of 65%. This means that the machine is only 65% efficient and losses amount to 35%.
- Availability is 85%, resulting in losses of 15% due to downtime.
- The performance level is also 85%, which means that the performance losses amount to 15%.
- Although the quality rate is 90%, this still means losses of ten percent.
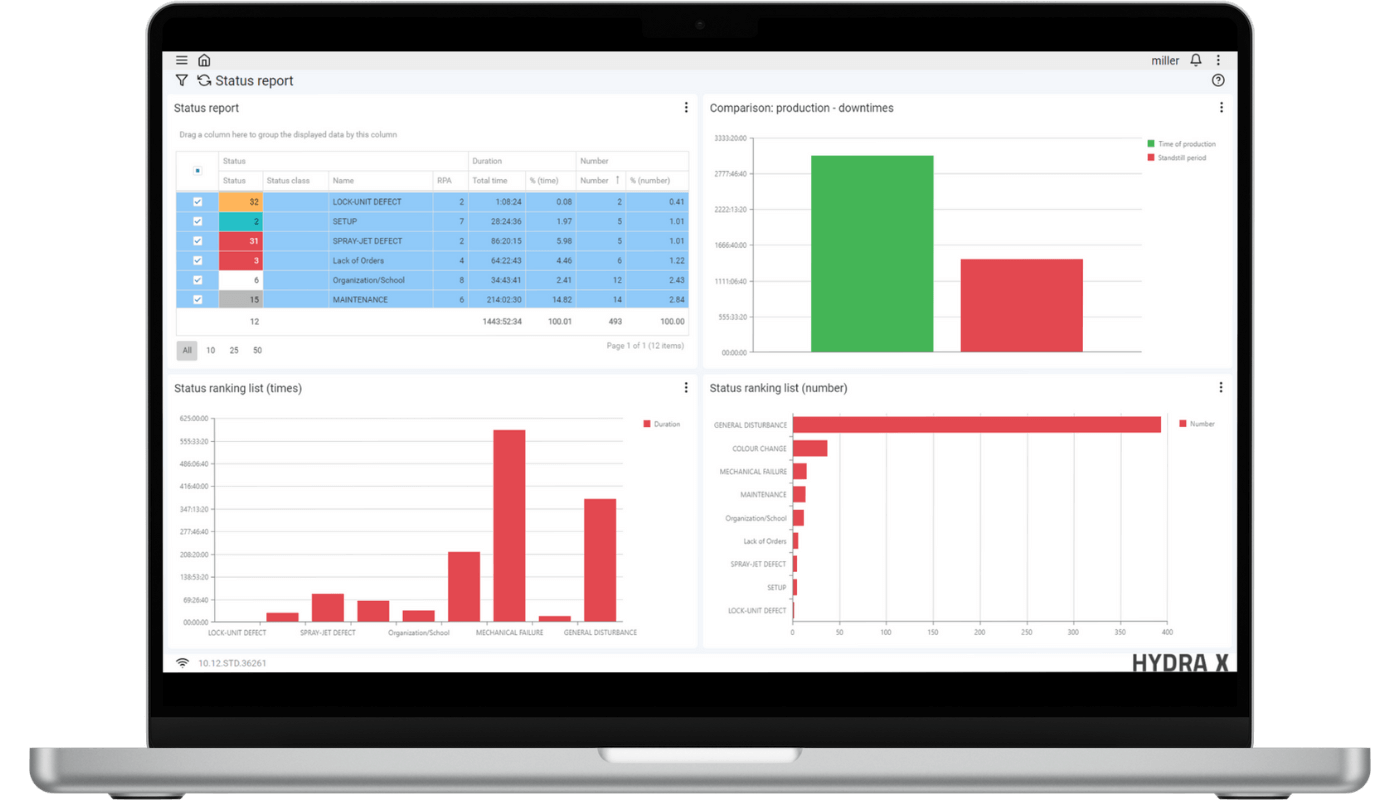
The pareto analysis in the MES shows that the machine stops most frequently due to a lack of orders. Lack of material and maintenance are further reasons for downtimes. The main focus should be on optimizing the production organization to eleminate the lack of orders in order to reduce downtimes. This alone significantly increases the machine's OEE index. If further improvements are then made to performance and quality, the OEE index increases accordingly.
OEE in the Manufacturing Execution System (MES) HYDRA X from MPDV
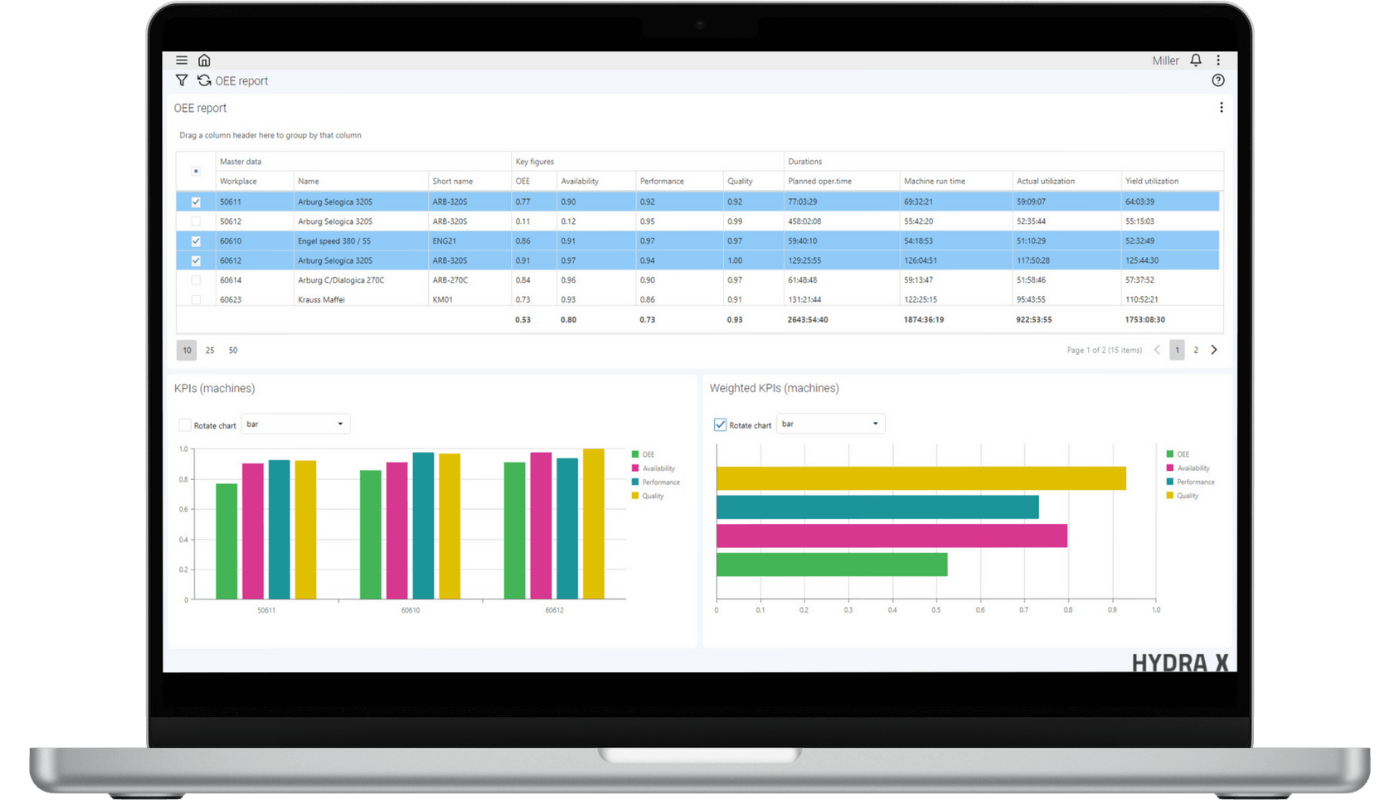
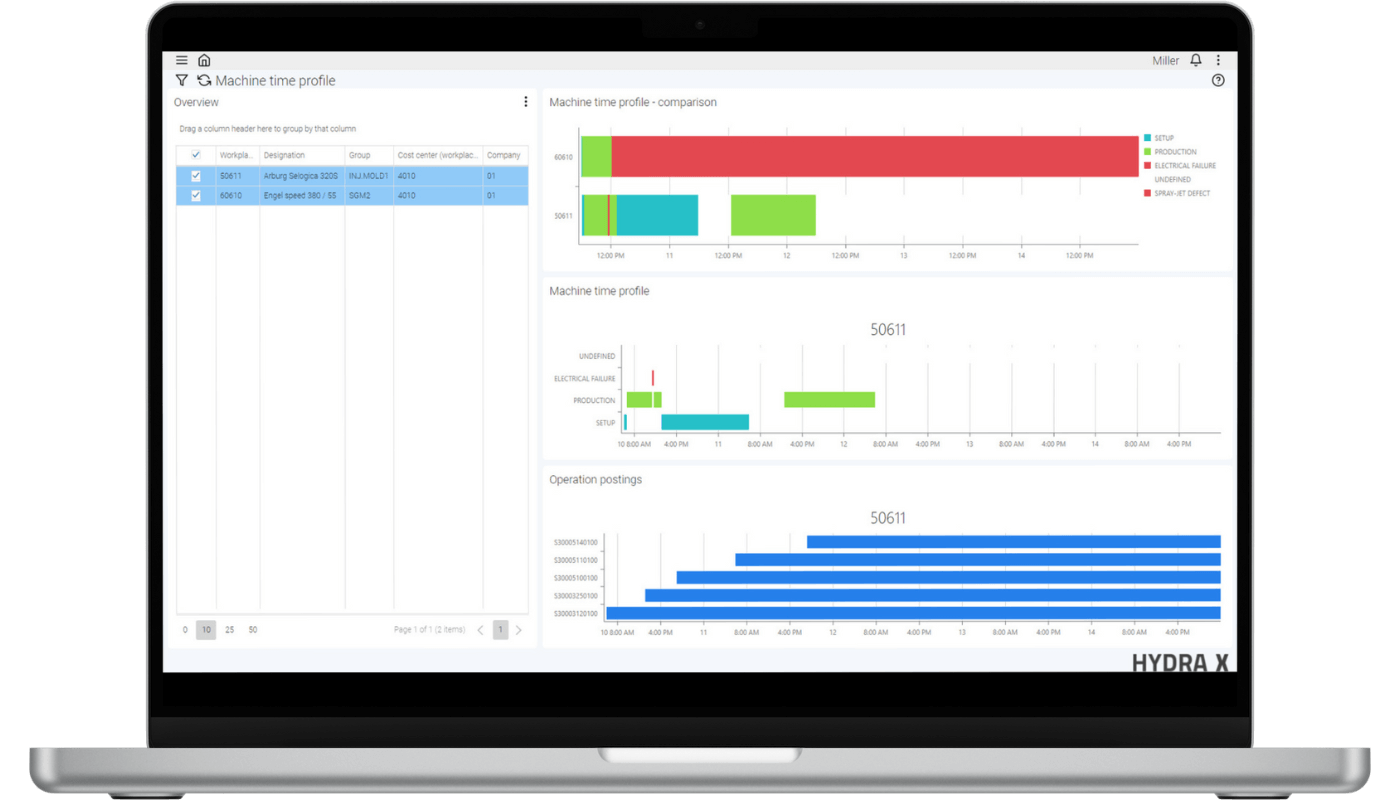
The Overall Equipment Effectiveness can easily be calculated in the Manufacturing Execution System (MES) HYDRA X from MPDV. The mApp Machine Performance KPIs uses the machine data collected in the MES, such as the machine status change or the quantities per machine/workplace. The software uses the available information to automatically calculate the OEE and other key production figures such as the utilization rate, the reject rate, or the technical efficiency.
This allows you to view the current machine performance and past performances. The key figures form a reliable basis for optimizing capacity utilization.
FAQ about Overall Equipment Effectiveness
The abbreviation OEE stands for Overall Equipment Effectiveness.
The OEE (Overall Equipment Effectiveness) is calculated from three factors, whereby each factor represents an aspect of equipment effectiveness: Availability, performance, and quality.
Availability rate × performance level × quality rate = OEE
The OEE index is a key figure that measures the effectiveness of a production unit. The Overall Equipment Effectiveness states how well a production unit is actually used in comparison to its maximum performance potential.
The OEE calculates the Overall Equipment Effectiveness from the three main factors of availability, performance, and quality. Manufacturers can use this data to fully evaluate the efficiency and productivity of their production units and machines. And there is more: disruptive factors that cause low OEE indexes are identified and can be eliminated systematically.
Overall, OEE is a critical indicator of a production company's competitiveness. The OEE provides insights into production performance and helps companies to achieve sustainable improvements in their processes and products, which makes OEE one of the most important key figures in the manufacturing industry.
A Manufacturing Execution System (MES) is essential for recording the required data in production. Based on this, the availability rate, performance level, quality rate and ultimately the Overall Equipment Effectiveness can be calculated.
- A low availability rate indicates that machine downtimes have occurred. As the MES not only records downtimes, but also the reasons for them, it is possible to make precise evaluations: a generic form is the pareto analysis. The pareto analysis enables you to detect the most common downtimes and to respond appropriately. If the 20% of most frequent reasons for downtime are eliminated, downtime can be reduced by around 80%.
- A low performance level indicates that the machine is not running at the speed at which it could run at best. An MES transparently displays the deviation from the production speed defined in the work plan to enable personnel to react with appropriate measures.
- A lowquality rate indicates that rejects or rework have occurred. By meticulously recording quality data in the MES, the reasons for failures are displayed transparently and can be reduced systematically.
An OEE of around 80% is considered a good value. An OEE index of 85% is a top value in discrete manufacturing. Although the aim is to achieve a value of 100%, this is virtually impossible. This would require production to run at maximum speed without any disruptions or failures and in top quality with no rejects.
OEE indexes of just 30% to 40% are often achieved in industry. By increasing the three factors of availability, performance, and quality consistently, productivity could be doubled.
OEE and OEE index can be used synonymously to describe the overall equipment effectiveness. In some cases, the term OEE index is used to refer to the percentage OEE value.
However, there is sometimes a fine distinction between the two terms.<
- OEE is a standardized key figure for measuring the efficiency of production machines and production units. The OEE is made up of availability, performance, and quality.
- The OEE index can be viewed as an extension of the OEE. For example, it includes additional user-defined parameters that are relevant for a specific production environment or certain industries to provide a more accurate picture of production units running effectively.
The differences between the terms are marginal. They are used to evaluate the efficiency of the production units and identify potential for improvement.
In addition to the OEE, the following key figures are determined as part of performance analyses to assess production processes or operating resources:
- Rate of capacity utilization
- Allocated capacity utilization
- Technical efficiency
- Availability
- Effectiveness
- Scrap rate
Overall Equipment Effectiveness (OEE) was developed in Japan in the 1960s as part of the Toyota Production System (TPS). This is a comprehensive production system that aims to maximize efficiency and minimize waste. This method is the foundation for Lean Manufacturing. It was not until the late 1980s that the OEE principle became more popular. The success of OEE is attributed to the book "TPM - Total Productive Maintenance: New Implementation Program in Fabrication and Assembly Industries" by Seiichi Nakajima, which was published in 1988. Nakajima is considered the founding father of Total Productive Maintenance (TPM).
Source
- Overall equipment effectiveness: Wikipedia, 07.02.2024 [online] https://en.wikipedia.org/wiki/Overall_equipment_effectiveness (requested on 18.03.2024).
Would you like more information? We are happy to help.
Just fill in the form below. We will take care of your inquiry promptly.
